Membuat Bar
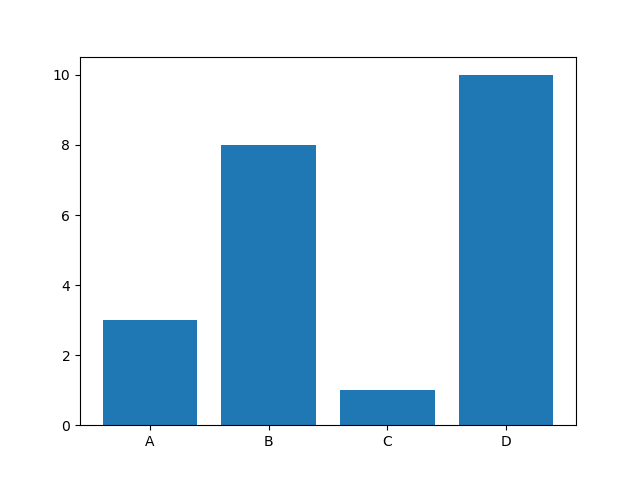
Dengan Pyplot, kita dapat menggunakan fungsi bar() untuk menggambar grafik batang.
Contoh:
Gambar 4 bar
import sys
import matplotlib
matplotlib.use('Agg')

import matplotlib.pyplot as plt
import numpy as np

x = np.array(["A", "B", "C", "D"])
y = np.array([3, 8, 1, 10])

plt.bar(x,y)
plt.show()

plt.savefig(sys.stdout.buffer)
sys.stdout.flush()
Hasilnya:
Fungsi bar() mengambil argumen yang mendeskripsikan layout bar.
Kategori dan nilainya diwakili oleh argumen pertama dan kedua sebagai array.
Contoh:
import sys
import matplotlib
matplotlib.use('Agg')

import matplotlib.pyplot as plt
import numpy as np

x = ["APPLES", "BANANAS"]
y = [400, 350]

plt.bar(x, y)
plt.show()

plt.savefig(sys.stdout.buffer)
sys.stdout.flush()
Bar Horisontal
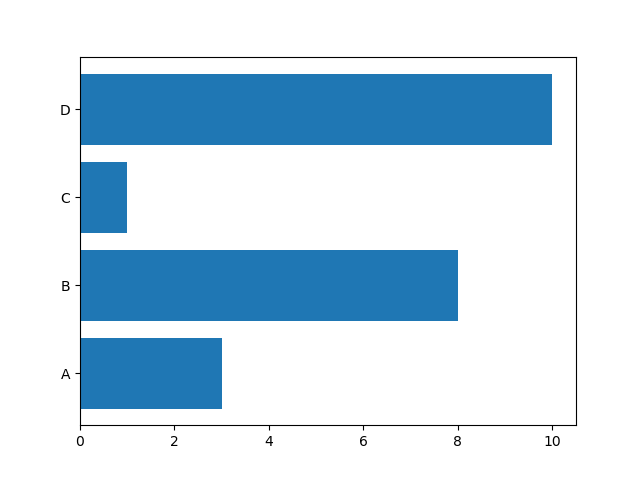
Jika kita ingin bar ditampilkan secara horizontal, bukan vertikal, gunakan fungsi barh().
Contoh:
Gambar 4 bar horizontal
import sys
import matplotlib
matplotlib.use('Agg')

import matplotlib.pyplot as plt
import numpy as np

x = np.array(["A", "B", "C", "D"])
y = np.array([3, 8, 1, 10])

plt.barh(x, y)
plt.show()

plt.savefig(sys.stdout.buffer)
sys.stdout.flush()
Hasilnya:
Warna Bar
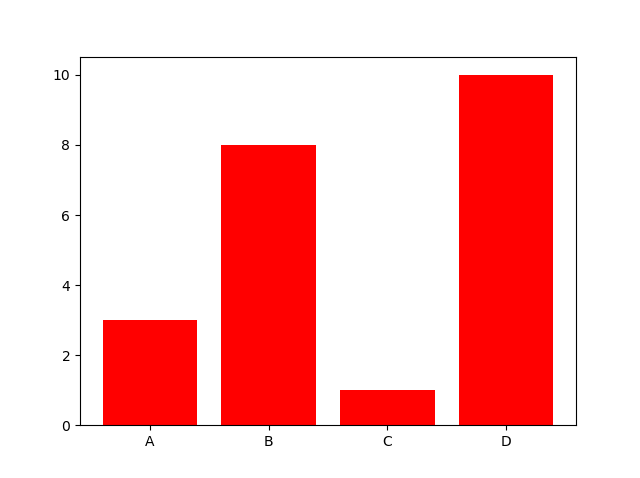
Bar() dan barh() mengambil argumen kata kunci color untuk mengatur warna bar.
Contoh:
Gambar 4 bar berwarna merah
import sys
import matplotlib
matplotlib.use('Agg')

import matplotlib.pyplot as plt
import numpy as np

x = np.array(["A", "B", "C", "D"])
y = np.array([3, 8, 1, 10])

plt.bar(x, y, color = "red")
plt.show()

plt.savefig(sys.stdout.buffer)
sys.stdout.flush()
Hasilnya:
Nama Warna
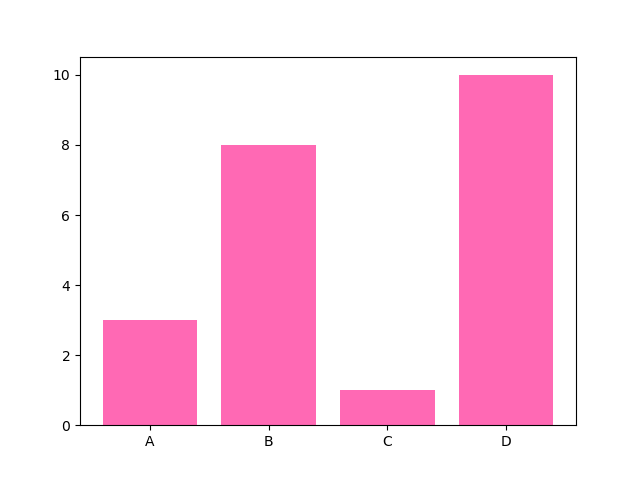
Kita dapat menggunakan salah satu dari 140 nama warna yang didukung.
Contoh:
Gambar 4 bar “hotpink”
import sys
import matplotlib
matplotlib.use('Agg')

import matplotlib.pyplot as plt
import numpy as np

x = np.array(["A", "B", "C", "D"])
y = np.array([3, 8, 1, 10])

plt.bar(x, y, color = "hotpink")
plt.show()

plt.savefig(sys.stdout.buffer)
sys.stdout.flush()
Hasilnya:
Warna Hex
Atau kita dapat menggunakan nilai warna heksadesimal:
Contoh:
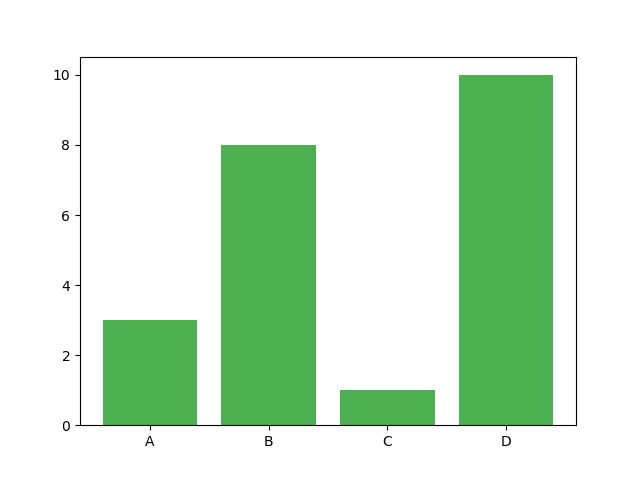
Gambarlah 4 bar dengan warna hijau
import sys
import matplotlib
matplotlib.use('Agg')

import matplotlib.pyplot as plt
import numpy as np

x = np.array(["A", "B", "C", "D"])
y = np.array([3, 8, 1, 10])

plt.bar(x, y, color = "#4CAF50")
plt.show()

plt.savefig(sys.stdout.buffer)
sys.stdout.flush()
Hasilnya:
Lebar Bar
Bar() dan barh() menggunakan argumen kata kunci width untuk mengatur lebar bar.
Contoh:
Gambar 4 bar yang sangat tipis
import sys
import matplotlib
matplotlib.use('Agg')

import matplotlib.pyplot as plt
import numpy as np

x = np.array(["A", "B", "C", "D"])
y = np.array([3, 8, 1, 10])

plt.bar(x, y, width = 0.1)
plt.show()

plt.savefig(sys.stdout.buffer)
sys.stdout.flush()
Hasilnya:
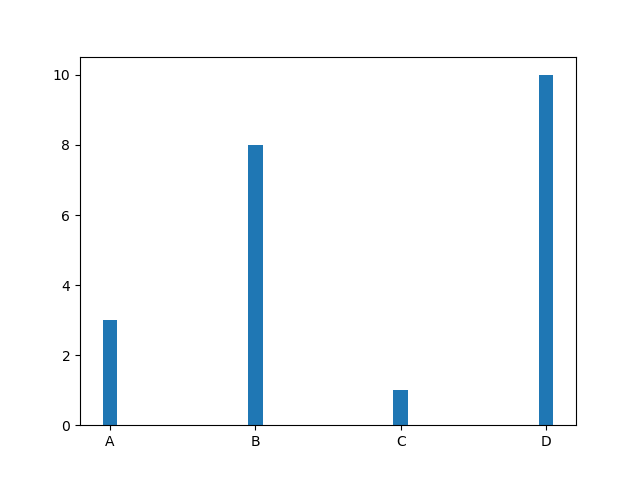
Nilai lebar default adalah 0.8