Anda dapat menggunakan kata kunci argumen marker untuk menekankan setiap titik dengan penanda yang ditentukan.
Contoh:
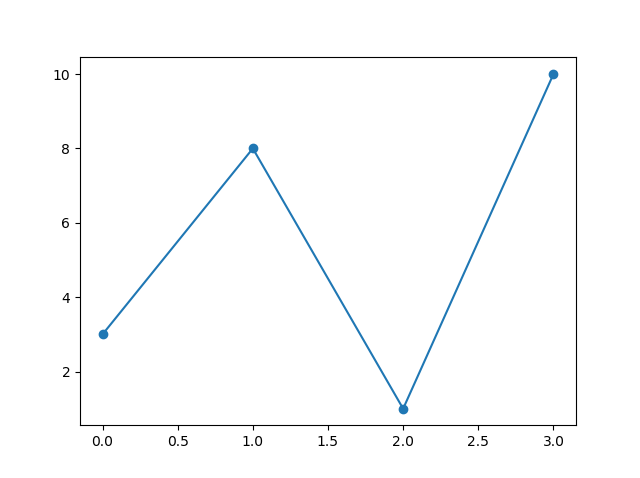
Tandai setiap titik dengan lingkaran
import matplotlib.pyplot as plt
import numpy as np

ypoints = np.array([3, 8, 1, 10])

plt.plot(ypoints, marker = 'o')
plt.show()
#Tiga baris agar kompiler kita bisa menggambar:
import sys
import matplotlib
matplotlib.use('Agg')

import matplotlib.pyplot as plt
import numpy as np

ypoints = np.array([3, 8, 1, 10])

plt.plot(ypoints, marker = 'o')
plt.show()

#Dua baris agar kompiler bisa menggambar:
plt.savefig(sys.stdout.buffer)
sys.stdout.flush()
Hasilnya:
Contoh:
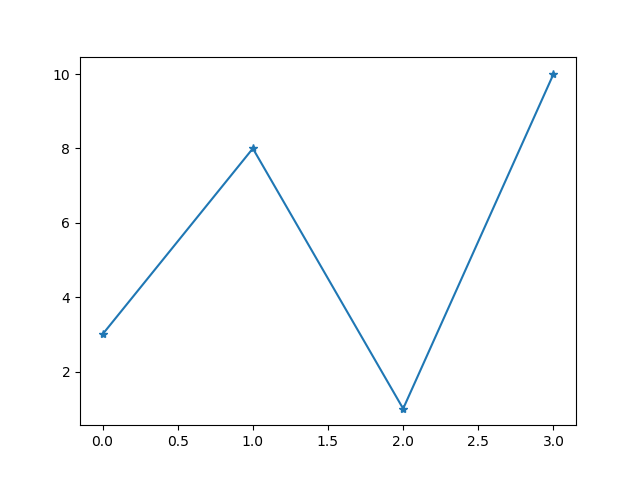
Tandai setiap titik dengan bintang
...
plt.plot(ypoints, marker = '*')
...
#Tiga baris agar kompiler kita bisa menggambar:
import sys
import matplotlib
matplotlib.use('Agg')

import matplotlib.pyplot as plt
import numpy as np

ypoints = np.array([3, 8, 1, 10])

plt.plot(ypoints, marker = '*')
plt.show()

#Dua baris agar kompiler kita bisa menggambar:
plt.savefig(sys.stdout.buffer)
sys.stdout.flush()
Hasilnya:
Section Artikel
Referensi Penanda (Marker)
Anda dapat memilih salah satu penanda berikut:
| Marker | Deskripsi |
|---|---|
| ‘o’ | Lingkaran |
| ‘*’ | Bintang |
| ‘.’ | Titik |
| ‘,’ | Pixel |
| ‘x’ | X |
| ‘X’ | X (filled) |
| ‘+’ | Plus |
| ‘P’ | Plus (filled) |
| ‘s’ | Kotak |
| ‘D’ | Diamond |
| ‘d’ | Diamond (kecil) |
| ‘p’ | Pentagon |
| ‘H’ | Hexagon |
| ‘h’ | Hexagon |
| ‘v’ | Segitiga Bawah |
| ‘^’ | Segitiga Atas |
| ‘<‘ | Segitiga Kiri |
| ‘>’ | Segitiga Kanan |
| ‘1’ | Tri Bawah |
| ‘2’ | Tri Atas |
| ‘3’ | Tri Kiri |
| ‘4’ | Tri Kanan |
| ‘|’ | Vline |
| ‘_’ | Hline |
Format String fmt
Anda juga dapat menggunakan parameter notasi string pintasan untuk menentukan penanda.
Parameter ini juga disebut fmt, dan ditulis dengan sintaks ini:
marker|line|color
Contoh:
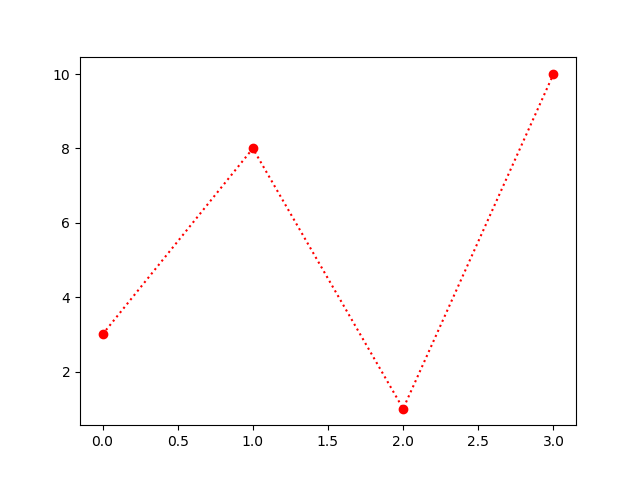
Tandai setiap titik dengan lingkaran
import matplotlib.pyplot as plt
import numpy as np

ypoints = np.array([3, 8, 1, 10])

plt.plot(ypoints, 'o:r')
plt.show()
#Tiga baris agar kompiler kita bisa menggambar:
import sys
import matplotlib
matplotlib.use('Agg')

import matplotlib.pyplot as plt
import numpy as np

ypoints = np.array([3, 8, 1, 10])

plt.plot(ypoints, 'o:r')
plt.show()

#Dua baris agar kompiler kita bisa menggambar:
plt.savefig(sys.stdout.buffer)
sys.stdout.flush()
Hasilnya:
Nilai penanda bisa apa saja dari Referensi Marker di atas.
Nilai Garis dapat berupa salah satu dari berikut ini:
Referensi Garis
| Syntax Garis | Deskripsi |
|---|---|
| ‘-‘ | Garis utuh |
| ‘:’ | Titik putus-putus |
| ‘–‘ | Garis putus-putus |
| ‘-.’ | Titik/ garis putus-putus |
Catatan: Jika kita tidak menentukan nilai baris di parameter fmt, maka tidak ada baris yang akan menjadi plot.
Singkatan nilai warna dapat berupa salah satu dari berikut ini:
Referensi Warna
| Syntax Warna | Deskripsi |
|---|---|
| ‘r’ | Red (Merah) |
| ‘g’ | Green (Hijau) |
| ‘b’ | Blue (Biru) |
| ‘c’ | Cyan |
| ‘m’ | Magenta |
| ‘y’ | Yellow ( Kuning) |
| ‘k’ | Black (Hitam) |
| ‘w’ | White (Putih) |
Ukuran Marker
Anda dapat menggunakan kata kunci argumen markersize atau versi yang lebih pendek yaitu ms untuk mengatur ukuran penanda:
Contoh
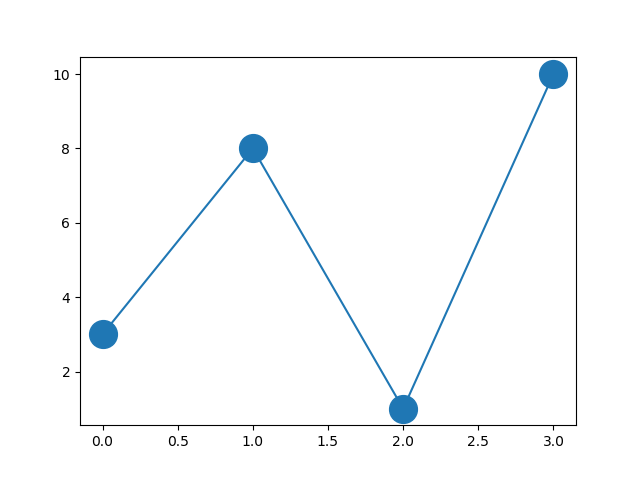
Atur ukuran penanda menjadi 20
import matplotlib.pyplot as plt
import numpy as np

ypoints = np.array([3, 8, 1, 10])

plt.plot(ypoints, marker = 'o', ms = 20)
plt.show()
#Tiga baris agar kompiler kita bisa menggambar:
import sys
import matplotlib
matplotlib.use('Agg')

import matplotlib.pyplot as plt
import numpy as np

ypoints = np.array([3, 8, 1, 10])

plt.plot(ypoints, marker = 'o', ms = 20)
plt.show()

#Dua baris agar kompiler kita bisa menggambar:
plt.savefig(sys.stdout.buffer)
sys.stdout.flush()
Hasilnya:
Anda bisa menggunakan kata kunci argumen markerfacecolor atau mfc yang lebih pendek untuk mengatur warna di dalam tepi marker:
Contoh
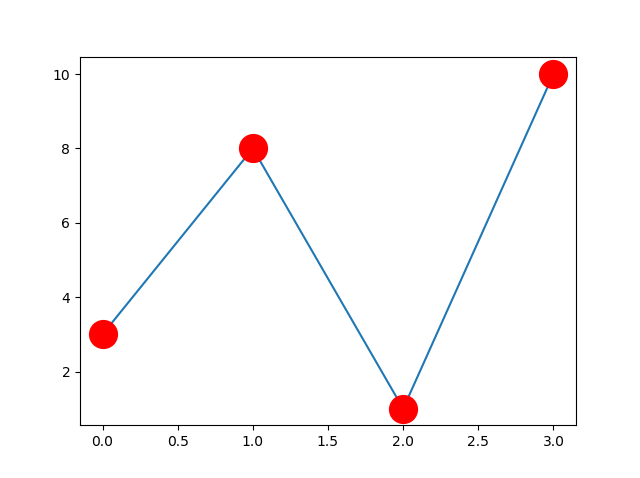
Atur warna FCE menjadi merah
import matplotlib.pyplot as plt
import numpy as np

ypoints = np.array([3, 8, 1, 10])

plt.plot(ypoints, marker = 'o', ms = 20, mfc = 'r')
plt.show()
#Tiga baris agar kompiler kita bisa menggambar:
import sys
import matplotlib
matplotlib.use('Agg')

import matplotlib.pyplot as plt
import numpy as np

ypoints = np.array([3, 8, 1, 10])

plt.plot(ypoints, marker = 'o', ms = 20, mfc = 'r')
plt.show()

#Dua baris agar kompiler kita bisa menggambar:
plt.savefig(sys.stdout.buffer)
sys.stdout.flush()
Hasilnya:

Gunakan argumen mec dan mfc untuk mewarnai seluruh marker:
Contoh
Atur warna tepi dan wajah menjadi merah
import matplotlib.pyplot as plt
import numpy as np

ypoints = np.array([3, 8, 1, 10])

plt.plot(ypoints, marker = 'o', ms = 20, mec = 'r', mfc = 'r')
plt.show()
#Three lines to make our compiler able to draw:
import sys
import matplotlib
matplotlib.use('Agg')

import matplotlib.pyplot as plt
import numpy as np

ypoints = np.array([3, 8, 1, 10])

plt.plot(ypoints, marker = 'o', ms = 20, mec = 'r', mfc = 'r')
plt.show()

#Two  lines to make our compiler able to draw:
plt.savefig(sys.stdout.buffer)
sys.stdout.flush()
Hasilnya:
Anda juga dapat menggunakan nilai warna heksadesimal:
Contoh
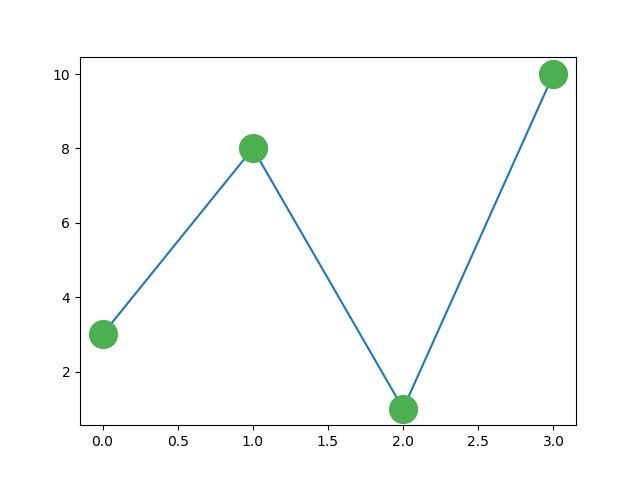
Tandai setiap titik dengan warna hijau yang indah
...
plt.plot(ypoints, marker = 'o', ms = 20, mec = '#4CAF50', mfc = '#4CAF50')
...
#Tiga baris agar kompiler kita bisa menggambar:
import sys
import matplotlib
matplotlib.use('Agg')

import matplotlib.pyplot as plt
import numpy as np

ypoints = np.array([3, 8, 1, 10])

plt.plot(ypoints, marker = 'o', ms = 20, mec = '#4CAF50', mfc = '#4CAF50')
plt.show()

#Dua baris agar kompiler kita bisa menggambar:
plt.savefig(sys.stdout.buffer)
sys.stdout.flush()
Hasilnya:
Atau salah satu dari 140 nama warna yang didukung.
Contoh
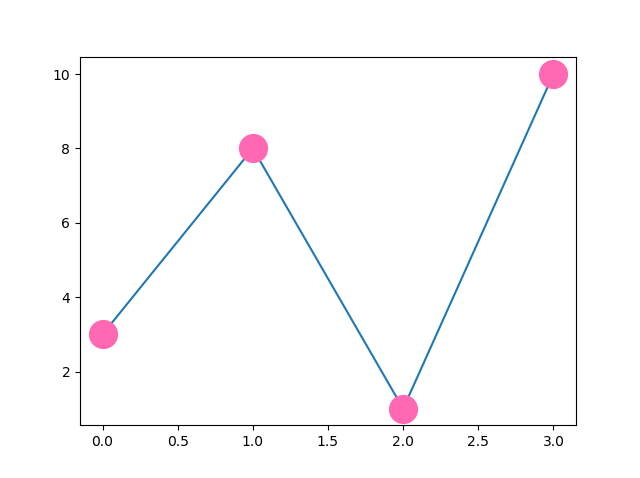
Tandai setiap titik dengan warna “hotpink”
...
plt.plot(ypoints, marker = 'o', ms = 20, mec = 'hotpink', mfc = 'hotpink')
...
#Tiga baris agar kompiler kita bisa menggambar:
import sys
import matplotlib
matplotlib.use('Agg')

import matplotlib.pyplot as plt
import numpy as np

ypoints = np.array([3, 8, 1, 10])

plt.plot(ypoints, marker = 'o', ms = 20, mec = 'hotpink', mfc = 'hotpink')
plt.show()

#Dua baris agar kompiler kita bisa menggambar:
plt.savefig(sys.stdout.buffer)
sys.stdout.flush()
Hasilnya: